Reports
Last updated: July 2026
Reports sum up your tracked time: time and earnings per client for the chosen period — at a glance, without a spreadsheet.
The reports screen
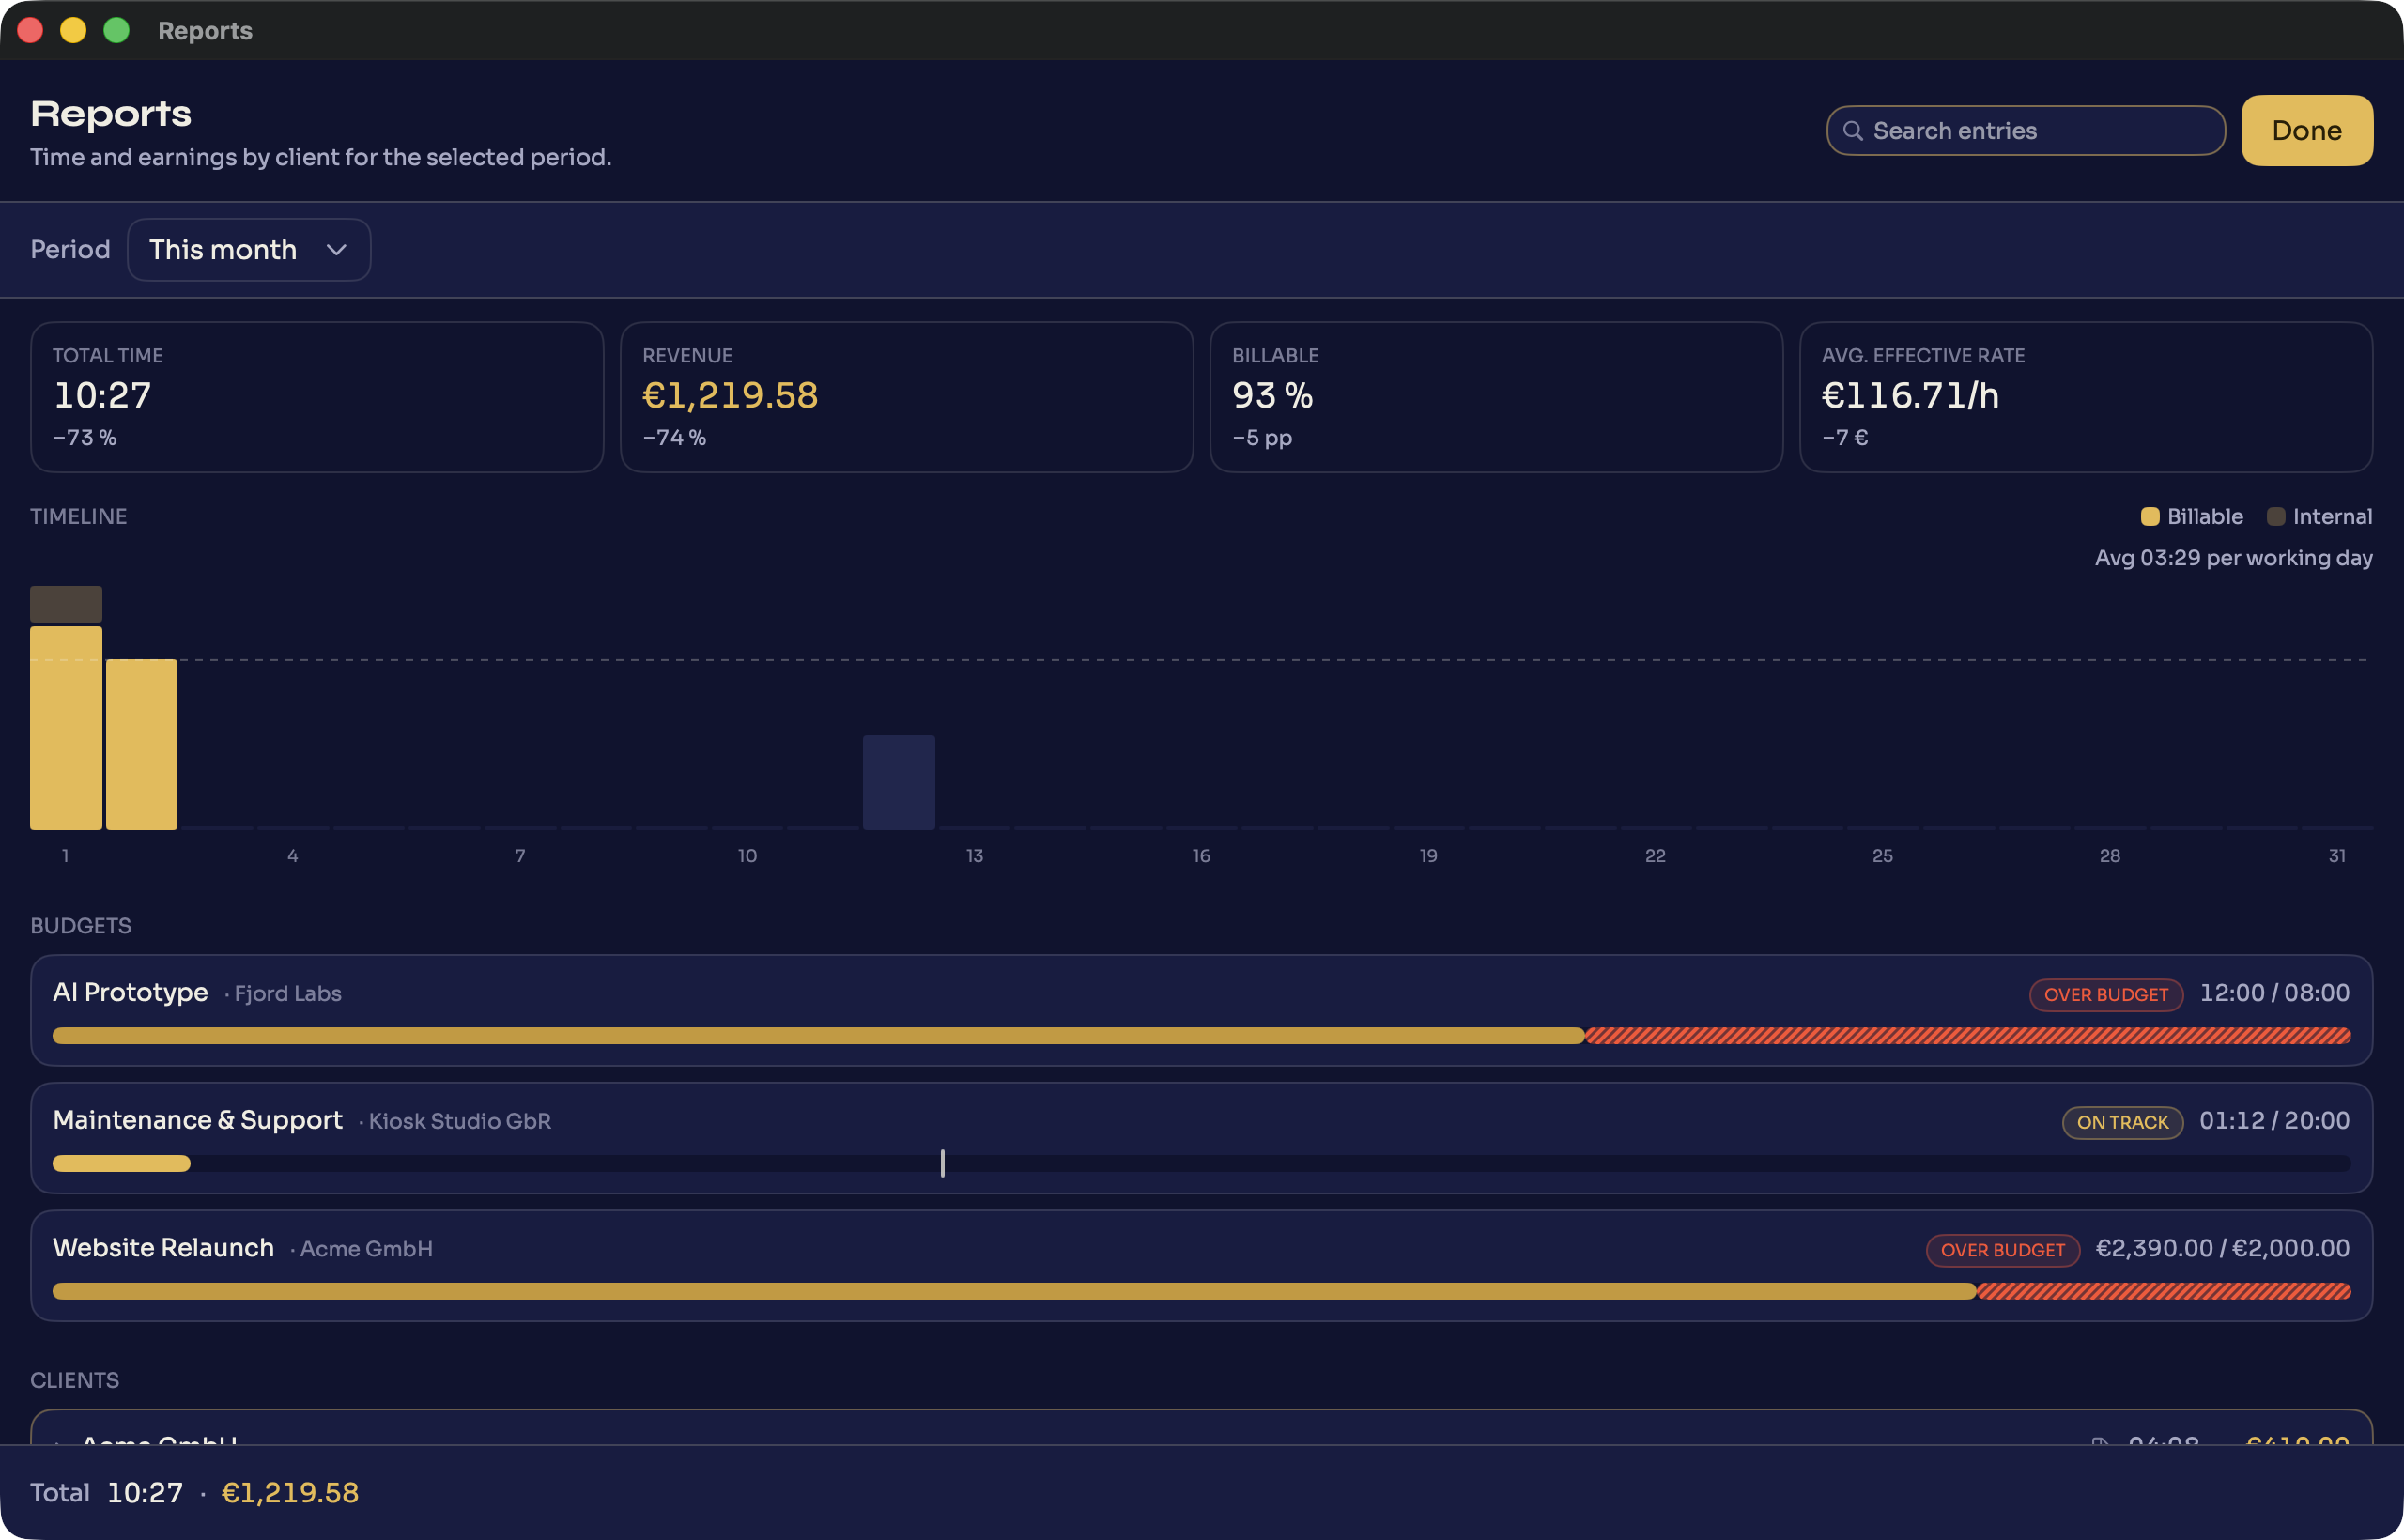
„Reports" in the footer opens the reports window. The „Period" control at the top sets the same range as in the popover (from „This week" to „All time"). Below it, from top to bottom, come the KPI tiles, the timeline chart, the budgets and the client list. „Done" closes the view.
KPI tiles
Four tiles summarize the selected period: „Total time", „Revenue", „Billable" (the billable share of total time) and „Avg. effective rate" (the hourly rate you actually achieved over the period). Below each value sits the change versus the previous period — as a percentage, in percentage points, or as an amount difference. With „All time" there is no previous period, so the delta stays empty; „Revenue" and „Avg. effective rate" only show a delta when both periods involve exactly the same single currency. For where to draw the line between billable and internal time, see billable vs non-billable hours.
The timeline chart
The „Timeline" chart shows your time as bars — by day, by week (for „This year") or by month (for „All time"), depending on the selected period. Each bar splits into „Billable" (gold) and „Internal" (dimmed); on daily bars, weekends are shown recessed. A dashed line marks the average per bar, and a fixed info line above the chart shows the exact values for the bar under your cursor. Clicking a bar opens the individual entries for that time slice.
Budgets
Projects with a budget appear here with a progress bar — independent of the period chosen above: monthly budgets count the current calendar month, budgets over the whole run count from the project's start. Only billable time or billable revenue counts against a budget, which can be defined either in hours or as a money amount. A badge states one of three states: „On track" (under 85% consumed), „Running low" (85–100%) and „Over budget" (over 100%, the overrun shown hatched); for monthly budgets, a thin line in the bar additionally marks the month's expected pace. Clicking a row expands it and shows the average consumption of the last 14 days plus, as long as budget remains, an estimate of when it runs out at that pace.
The client list
Below that, „Clients" lists every client with total time and earnings for the selected period, sorted descending by earnings — the client with the highest earnings is highlighted in gold, the rest in indigo. The bar also shows what share of the time was billable (fully filled) versus internal (paler). Clicking a row expands it to show that client's projects individually, each with its own time and earnings. The document icon, or a row's context menu, saves a timesheet for that client and period as a PDF.
Export as CSV
You find the export not in the reports but right in the popover: next to the „Earned" row sits the „CSV export" button. It saves the chosen period's time entries as a CSV file — with columns such as Date, Client, Project, Description, Notes, Billable, Start Time, End Time, Hourly Rate and amount. That gets your times into a spreadsheet or invoicing software.